
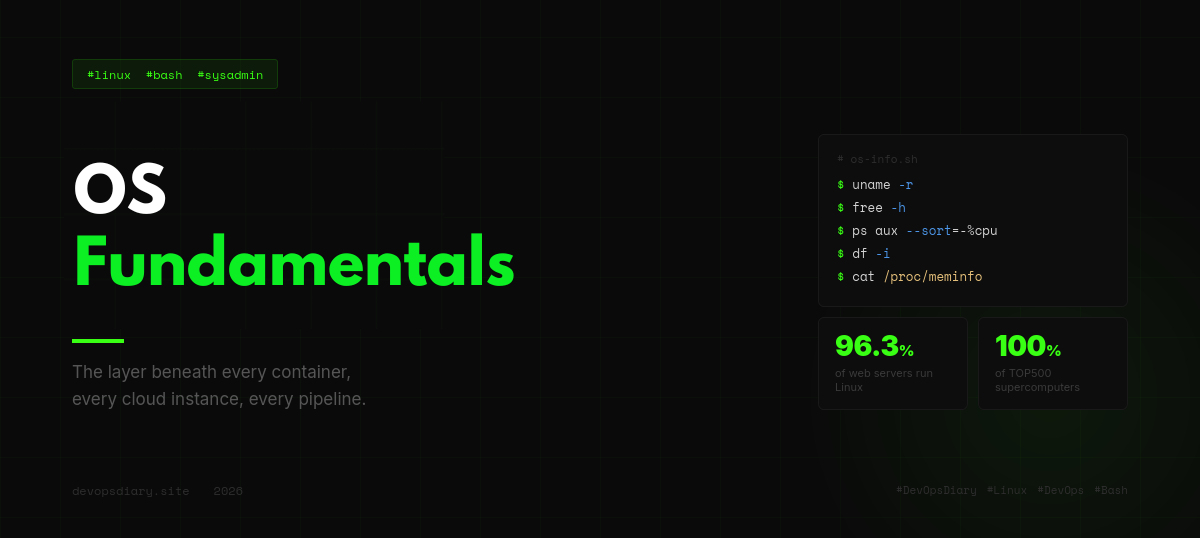
OS Fundamentals
Before doing anything with Docker, before writing a single Terraform file, before configuring a CI/CD pipeline, there is a layer on which everything runs. That layer is the operating system.
And for a DevOps engineer, Linux is that operating system.
This is Task 02 of the DevOpsDiary beginner path. The deliverable is a Bash script called os-info.sh that collects and displays detailed information about the system it runs on. By the end of this post, you will understand not only how to build that script, but why each piece of information it collects actually matters.
What an Operating System Actually Does
Most people interact with an operating system through a graphical interface and never think much beyond that. But when you manage infrastructure, the mental model you need is different.
An operating system is the software that sits between the hardware and everything else. It manages physical resources like CPU time, memory pages, disk blocks, and network interfaces, and exposes them to processes through a layer of abstractions. You do not write directly to RAM. You do not talk directly to the network card. You ask the kernel, and the kernel decides what to do.
The kernel is the core of the operating system. It runs in privileged mode, controlling the hardware directly. Everything else, including your shell, your web server, and your Python script, runs in userspace, making requests to the kernel through a defined interface called system calls. When your script opens a file, it calls open(). When it forks a new process, it calls fork(). The kernel handles the rest.
Linux specifically is a monolithic kernel originally written by Linus Torvalds in 1991. Today it runs on most servers in the world, on every Android device, and on a large portion of developer workstations.
The /proc Filesystem: The Kernel Talking Directly to You
One of the most important concepts in Linux is that everything is a file.
The /proc filesystem is a virtual filesystem, which means it does not exist on disk. It is created by the kernel in memory and represents the live state of the running system. When you read /proc/meminfo, you are not reading a file that some daemon updated five minutes ago. You are reading the kernel's current understanding of memory usage, at the exact moment of reading.
cat /proc/meminfo
That single command is the foundation of tools like free, htop, and practically every monitoring agent you will ever deploy. Understanding /proc means understanding where the data actually comes from.
Important files worth knowing:
/proc/cpuinfo: details about each CPU core/proc/meminfo: memory statistics/proc/uptime: system uptime in seconds/proc/loadavg: load averages for 1, 5, and 15 minutes/proc/[PID]/: a directory for each running process, containing its status, open file descriptors, memory maps, and more
When you run ps aux, it reads /proc. When top updates every second, it reads /proc. This virtual filesystem is the source of truth for system state in Linux.
System Identification
The first section of os-info.sh is about identity. Before diagnosing anything, you need to know exactly what system you are on.
#!/bin/bash

TIMESTAMP=$(date '+%Y-%m-%d %H:%M:%S')

echo "======================================"
echo "  SYSTEM REPORT - $TIMESTAMP"
echo "======================================"

echo ""
echo "[ SYSTEM IDENTIFICATION ]"
echo ""

if [ -f /etc/os-release ]; then
    . /etc/os-release
    echo "Distribution : $PRETTY_NAME"
fi

echo "Kernel       : $(uname -r)"
echo "Architecture : $(uname -m)"
echo "Hostname     : $(hostname)"
echo "FQDN         : $(hostname -f 2>/dev/null || echo 'N/A')"
The /etc/os-release file is the standard way to identify a Linux distribution. You load it as a shell script because it is simply a list of KEY=VALUE pairs. uname -r gives you the running kernel version, which matters when you are checking for known vulnerabilities or confirming that a kernel update actually took effect.
In a real environment, you may be SSH-ing into a machine you have never touched before. Starting a diagnostic session with this information prevents a whole category of errors caused by assuming the wrong OS, the wrong architecture, or the wrong kernel.
Runtime Statistics
The next section captures what the system is doing right now, not what it was doing when it booted.
echo ""
echo "[ RUNTIME STATISTICS ]"
echo ""

echo "Uptime       : $(uptime -p)"
echo "Load Average : $(uptime | awk -F'load average:' '{print $2}')"
echo "Date/Time    : $(date)"

echo ""
echo "Logged-in Users:"
who

echo ""
echo "Last Logins (5 most recent):"
last | head -5
Load average deserves attention. It represents the average number of processes that are running or waiting to run over the last 1, 5, and 15 minutes. A load average of 1.0 on a single-core machine means the CPU is fully busy. The same value on an 8-core machine means it is barely being used. Always compare the load average against the number of CPU cores.
A load average persistently above the number of cores is the first signal that something is wrong. This is not an alert you need a monitoring platform to see. Running uptime tells you instantly.
Process Information: What Is Actually Running
Every piece of software running on a Linux system is a process. Processes have a PID, a parent PID, an owner, a state, and resource consumption metrics. Understanding processes means understanding what the system is actually doing.
echo ""
echo "[ PROCESS INFORMATION ]"
echo ""

echo "Total Processes: $(ps aux | wc -l)"
echo ""

echo "Top 5 by CPU:"
ps aux --sort=-%cpu | awk 'NR==1 || NR<=6' | awk '{printf "%-10s %-8s %-8s %s\n", $1, $2, $3, $11}'

echo ""
echo "Top 5 by Memory:"
ps aux --sort=-%mem | awk 'NR==1 || NR<=6' | awk '{printf "%-10s %-8s %-8s %s\n", $1, $2, $4, $11}'
The ps aux flags mean: a shows processes from all users, u uses a user-oriented format with CPU and memory percentages, x includes processes not attached to a terminal.
During a production incident, checking which process is consuming unexpected resources is standard procedure. This section of the script gives you that answer in seconds.
Memory Usage: Understanding What /proc/meminfo Is Telling You
Memory management in Linux is frequently misunderstood. The most common misconception is thinking that high memory usage is a problem. It is not. Idle RAM is wasted RAM. Linux actively caches file data in memory to speed up reads, and releases that cache when a process actually needs the memory.
echo ""
echo "[ MEMORY USAGE ]"
echo ""

echo "Memory Overview:"
free -h

echo ""
echo "Swap:"
swapon --show 2>/dev/null || echo "No swap configured"

echo ""
echo "Key metrics from /proc/meminfo:"
awk '/MemTotal|MemAvailable|MemFree|Cached|SwapTotal|SwapFree/ {printf "%-20s %s\n", $1, $2" "$3}' /proc/meminfo
The numbers that actually matter in free -h are MemTotal and available. Not free. The available column is an estimate of how much memory is available for new processes, accounting for reclaimable cache. free (the raw column) shows only completely idle memory, which tends to sit near zero on a healthy, busy system. Seeing free near zero is not a problem. Seeing available near zero is.
Swap is disk space used as memory overflow. When a process needs memory and RAM is full, the kernel moves less-used pages to swap. Swap activity is expensive because disk I/O is orders of magnitude slower than RAM. Persistent heavy swap usage, known as thrashing, is a serious performance problem.
Storage Information: Disk Usage and Inodes
Disk space is finite and filesystems can fill up in ways that are not always obvious from a single number.
echo ""
echo "[ STORAGE INFORMATION ]"
echo ""

echo "Disk Usage by Filesystem:"
df -h --output=source,fstype,size,used,avail,pcent,target | column -t

echo ""
echo "Disk Usage by Directory:"
du -sh /var /home /opt /tmp 2>/dev/null

echo ""
echo "Inode Usage:"
df -i --output=source,iused,ifree,ipcent,target | column -t
The inode section is often overlooked. An inode is a data structure that stores metadata about a file: its permissions, owner, timestamps, and the physical locations of its data blocks on disk. Each filesystem has a fixed number of inodes, defined at creation time.
It is entirely possible to have free disk space but no available inodes. If you run out of inodes, you cannot create new files, even if df -h shows available space. This scenario has caused production outages on systems that generate large numbers of small files, such as mail queues, session stores, or log directories that write one file per request.
df -i shows inode usage. It belongs in any monitoring setup.
Why OS Fundamentals Matter for DevOps
A common path into DevOps goes straight to the tools: Docker, Kubernetes, Terraform. Those tools are essential. But they abstract over the operating system, they do not replace it.
When a container process is consuming excessive CPU, you are looking at Linux process scheduling. When a Kubernetes pod gets OOMKilled, you are looking at Linux memory management and cgroup limits. When a Terraform-managed EC2 instance stops responding, you SSH in and run ps aux and free -h.
The operating system does not disappear behind the abstractions. It becomes exactly what you need to understand when the abstractions fail.
This task is called OS Fundamentals because that is precisely what it is: the foundation. Every task that comes after in this path builds on what you learned here. To go deeper on operating systems, two books are essential reading:
- "Operating Systems: Three Easy Pieces" by Remzi H. Arpaci-Dusseau and Andrea C. Arpaci-Dusseau. Free at ostep.org. Covers processes, memory virtualization, concurrency, and persistence with clarity and practical depth. The best starting point for anyone serious about understanding how an OS works.
- "The Linux Programming Interface" by Michael Kerrisk. The definitive reference for Linux system programming. It covers system calls, processes, signals, memory, filesystems, and the full POSIX API in exhaustive detail. If you want to understand what is actually happening when Linux runs your code, this is the book.
- Linux Kernel Documentation: https://www.kernel.org/doc/html/latest/
- Brendan Gregg: Understanding Linux Load Averages: https://www.brendangregg.com/blog/2017-08-08/linux-load-averages.html
- Netflix Tech Blog: Linux Performance Analysis in 60,000 Milliseconds: https://netflixtechblog.com/linux-performance-analysis-in-60-000-milliseconds-accc10403c55
- Linux /proc filesystem documentation: https://www.kernel.org/doc/html/latest/filesystems/proc.html